About
Disasters in the 21st century have resulted in persistent increased in morbidity and mortality, long after the acute event has passed. In the United States, wildfires and hurricanes typically result in power outages and evacuations, disrupting access to wages, healthcare, food security, and stable housing – sometimes for extended periods of time. In order to protect medically-vulnerable populations, response agencies and health systems need to know who is moving, when they are moving, and where they are moving to in order to mobilize material resources and personnel effectively.
As the incidence of these crises increases, it is important to ensure that emergency preparedness and response efforts are able to meet the needs of the medically vulnerable, and socially disadvantaged.
Since 2019, our team at CrisisReady has collaborated with public health response agencies in California, including members of California Department of Public Health (CDPH), California Governor’s Office of Emergency Services (CalOES), The California Conference of Local Health Officers (CCLHO), Emergency Medical Services Authority (EMSA), and hospital systems to strengthen data-driven decision making. ReadyMapper, launched in 2022, is being deployed across partners during the 2022 wildfire season. Our ongoing related research is focused on health system resilience during and in preparation for wildfires.
The ReadyMapper Tool
CrisisReady has developed ReadyMapper, a health systems resilience decision support system that presents information needed to optimize resource allocation during disasters from novel, but disparate, data streams. The tool is the outcome of a three-year collaborative effort between the CrisisReady team and public health and response agencies, hospitals and health systems and health officials across California. Our technical partners include Stamen Design.
The tool combines data on community demographics, vulnerabilities, infrastructure, and mobility to track evolving medical needs as populations evacuate and move elsewhere.
Mapping Vulnerability
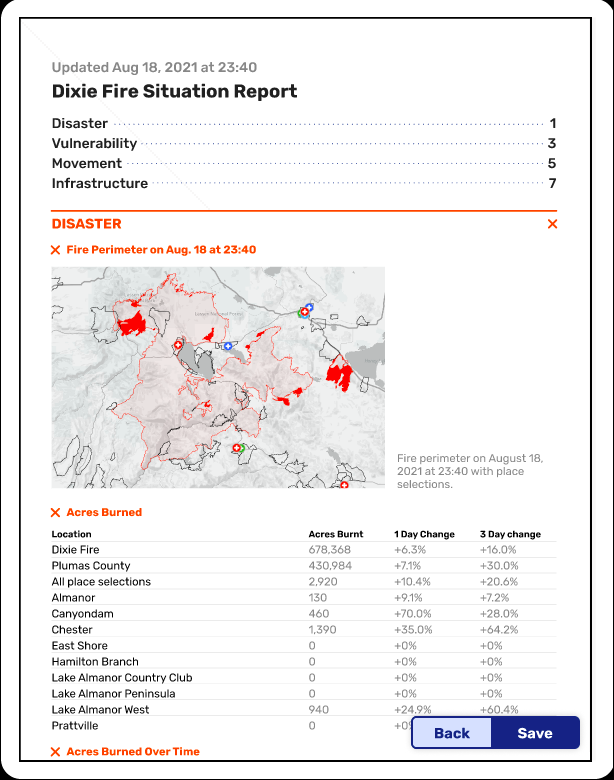
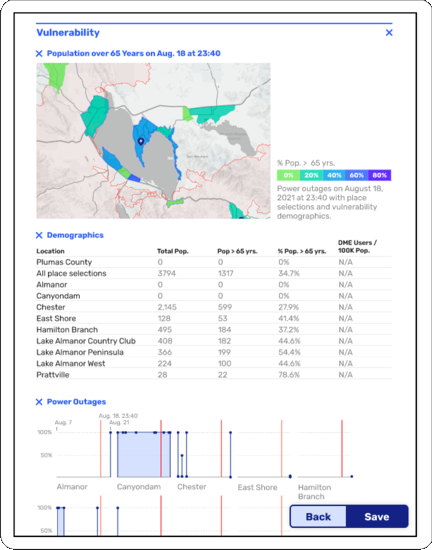
The tool’s first vantage point presents data on population vulnerabilities, which can be defined in multiple and often intersecting ways.
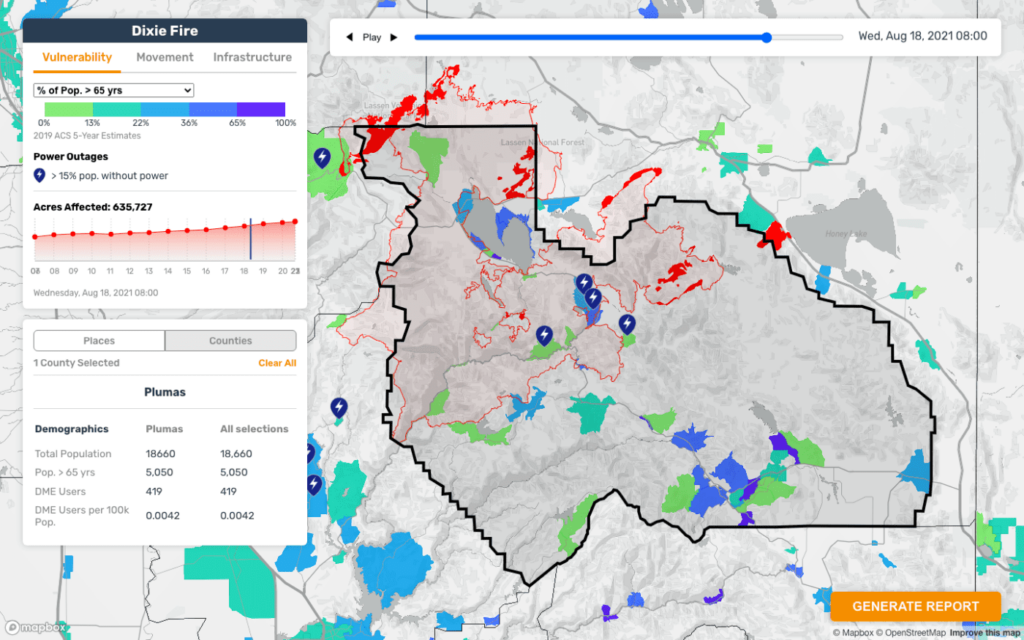
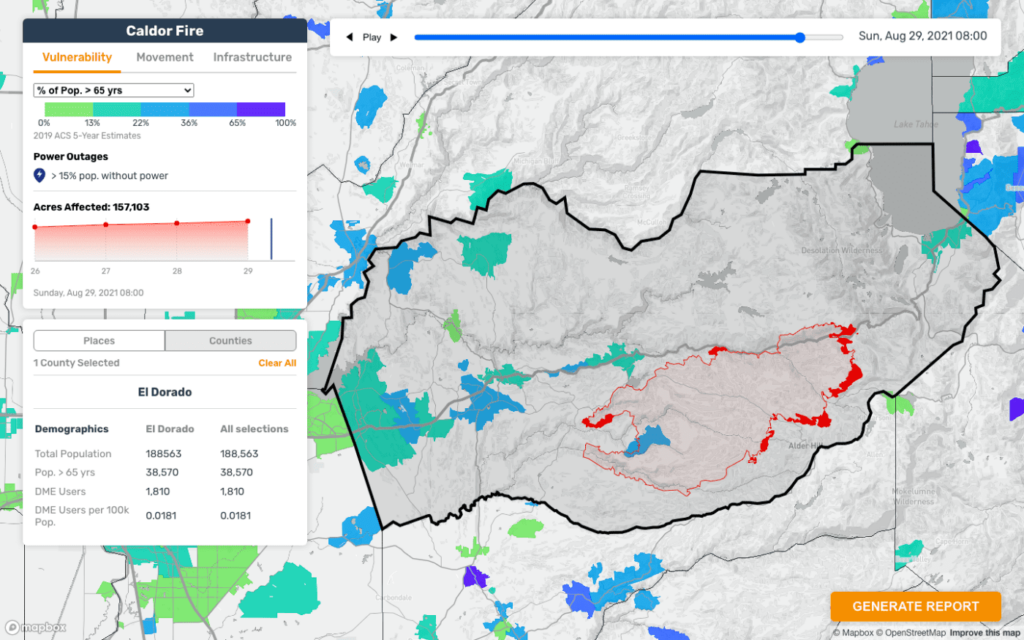
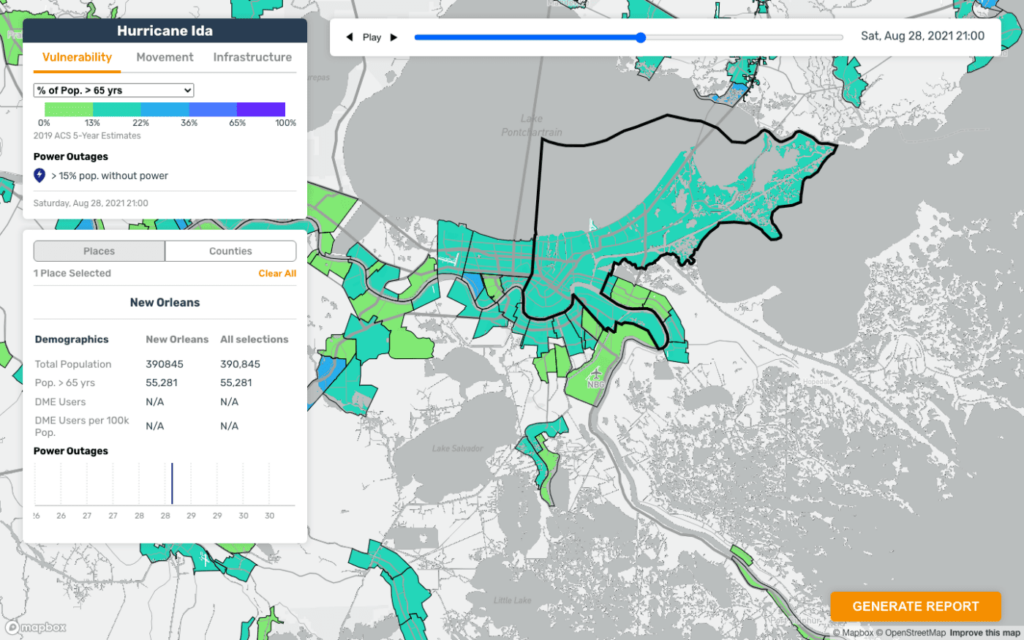
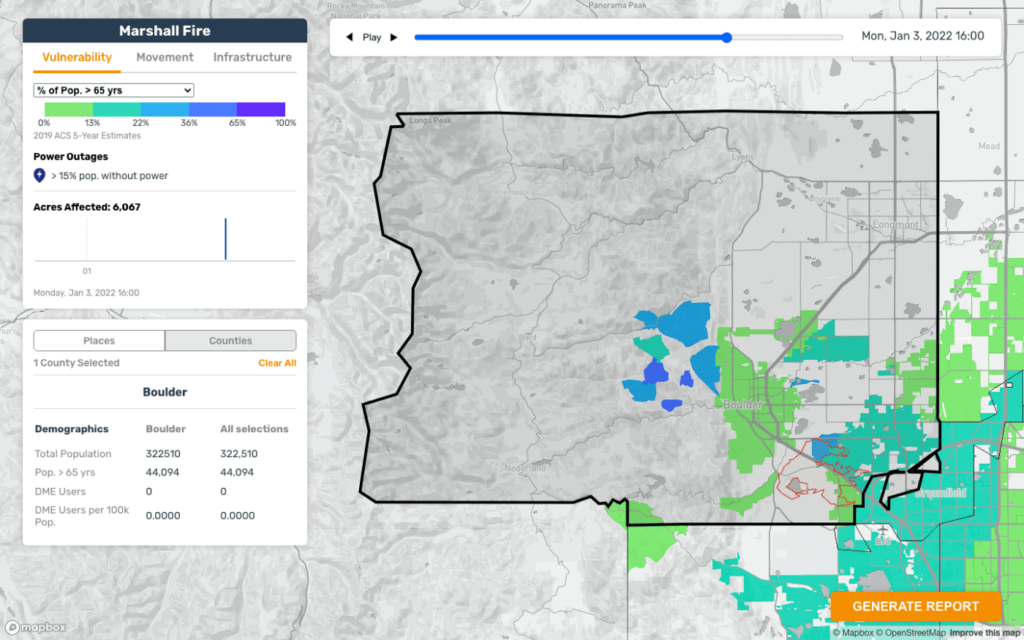
Here, data reflecting the number of individuals over the age of 65 years old as representative of several types of vulnerabilities, such as the need for medical care, food security, assistance with mobility, and access to durable medical equipment.
There are other composite indices taken into account, including the Healthy Places Index (HPI) published by the Public Health Alliance of Southern California’s and the Social Vulnerability index published by the Centers for Disease Control and Prevention (CDC) and the Agency for Toxic Substances and Disease Registry (ATSDR). Immigration status and language barriers are additional vulnerabilities considered in these visualizations.
Mapping Movement
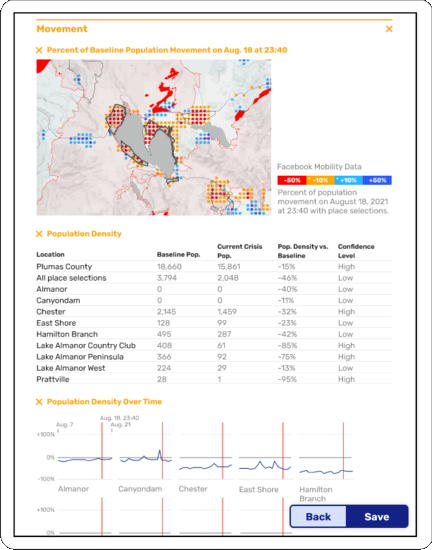
The tool’s second vantage point presents data on human mobility and movement patterns during an emergency event. These data provide information about where communities are evacuating from, where they are going, and when they are moving.
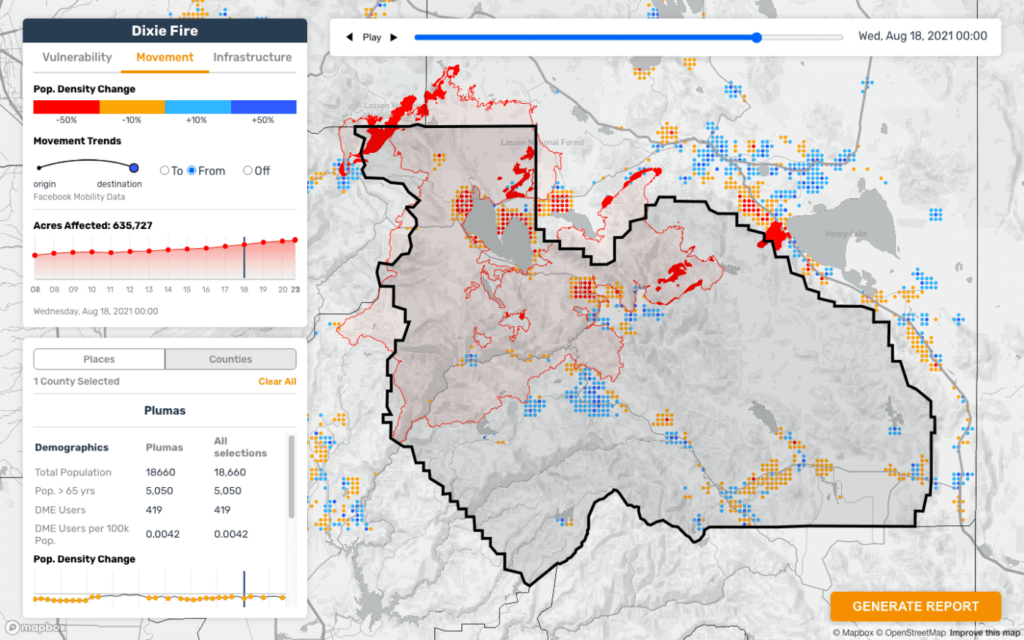
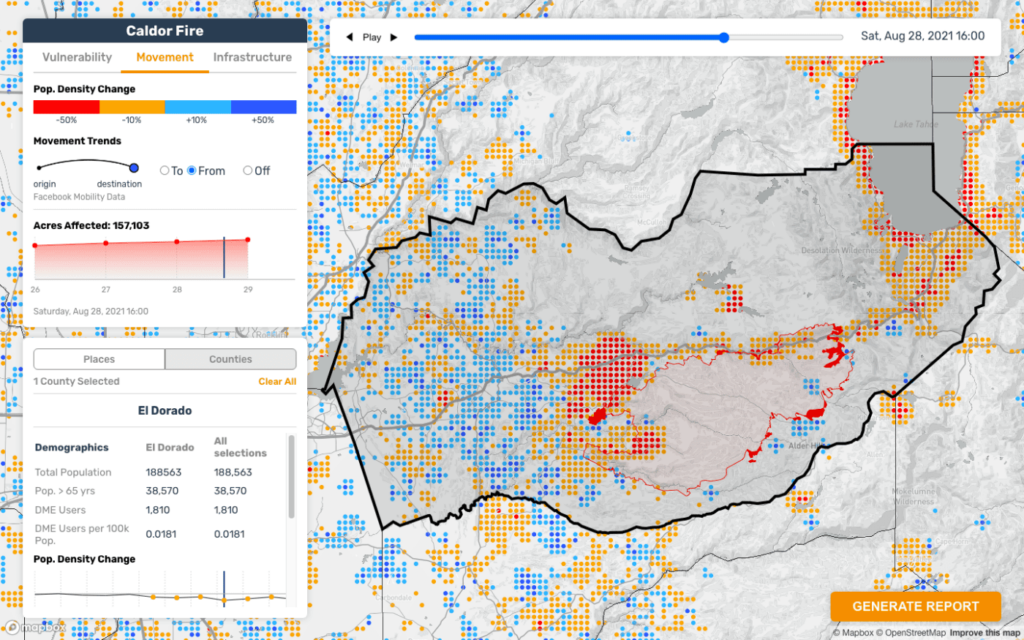
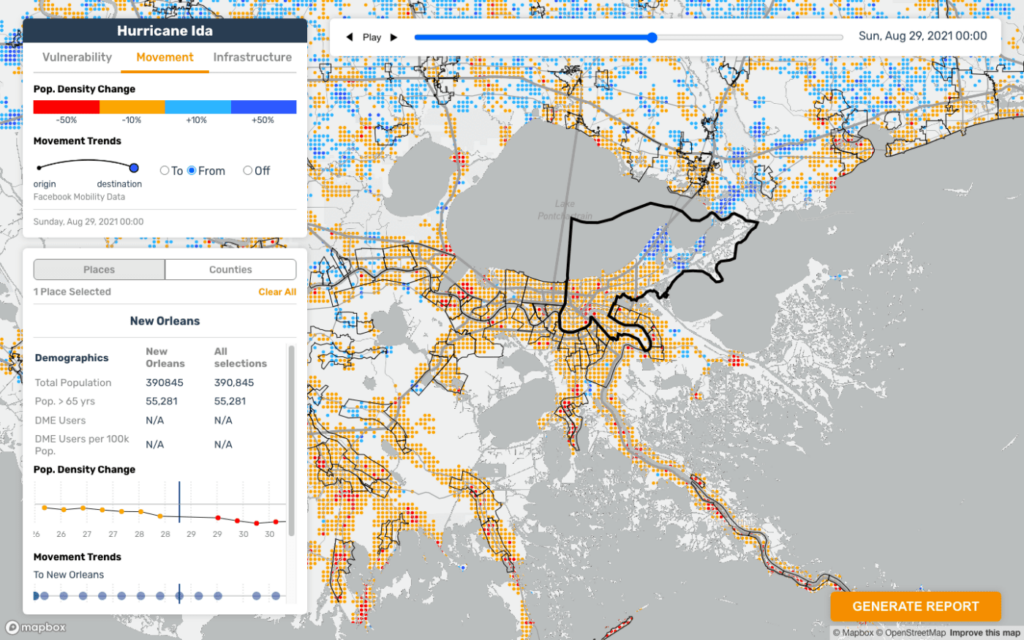
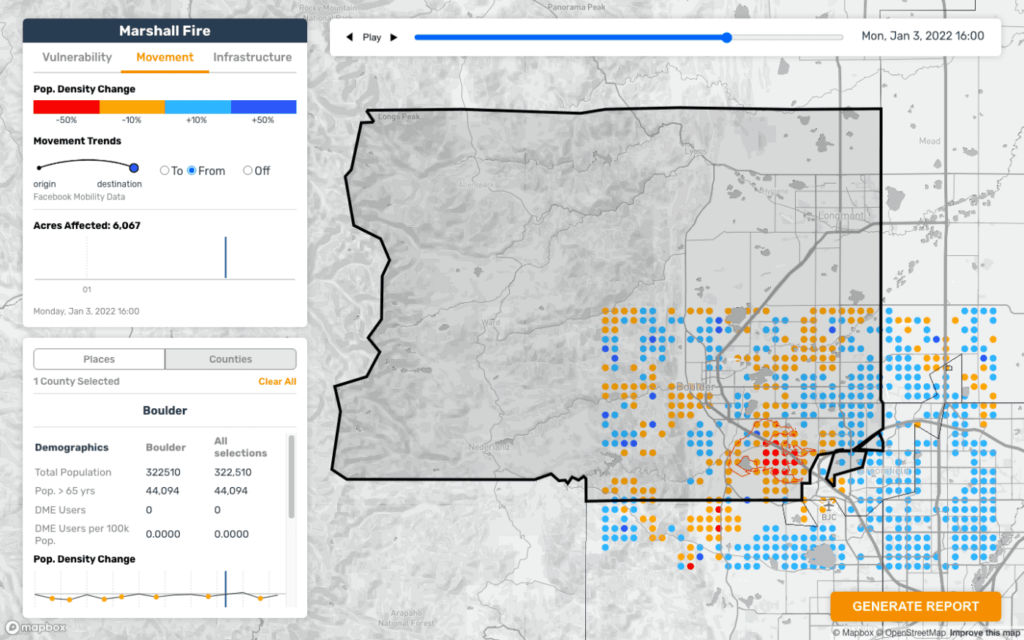
The patterns these data highlight have important implications for the allocation of aid and the anticipation of patient needs at medical facilities during (or after) evacuation activities take place. They also provide important information for response agencies to understand which areas people should move towards to ensure their safety.
These visualizations are generated from aggregated and anonymized data made available by Meta (formerly Facebook).
Mapping Healthcare Infrastructure
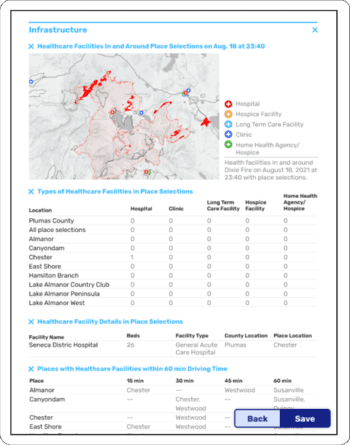
The third vantage point presents data on healthcare facilities located in areas impacted by an emergency event. These data help identify what services are threatened or lost during a disaster and what services remain available to affected communities.
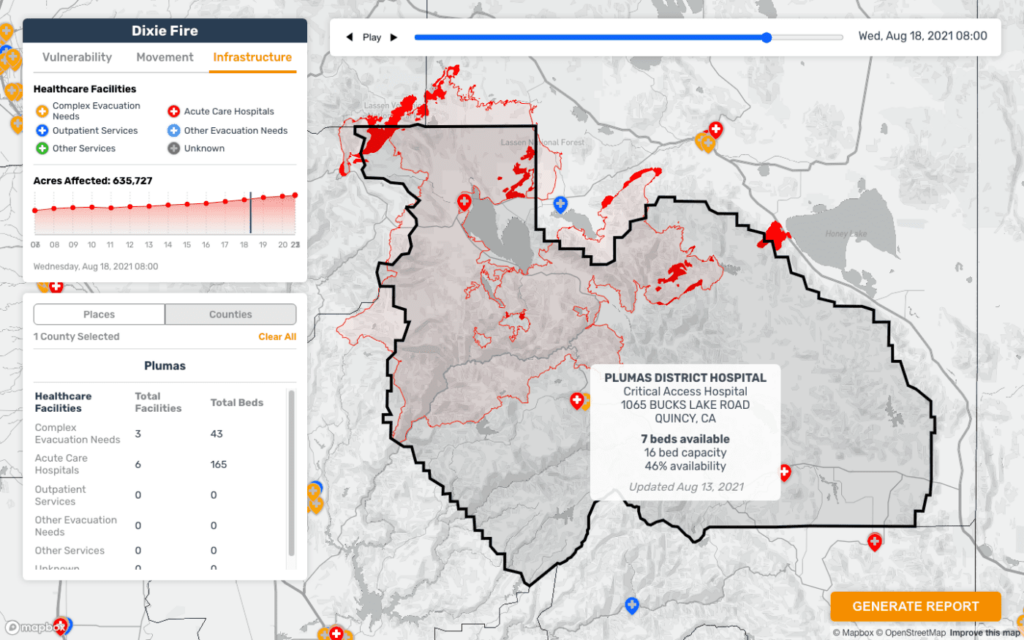
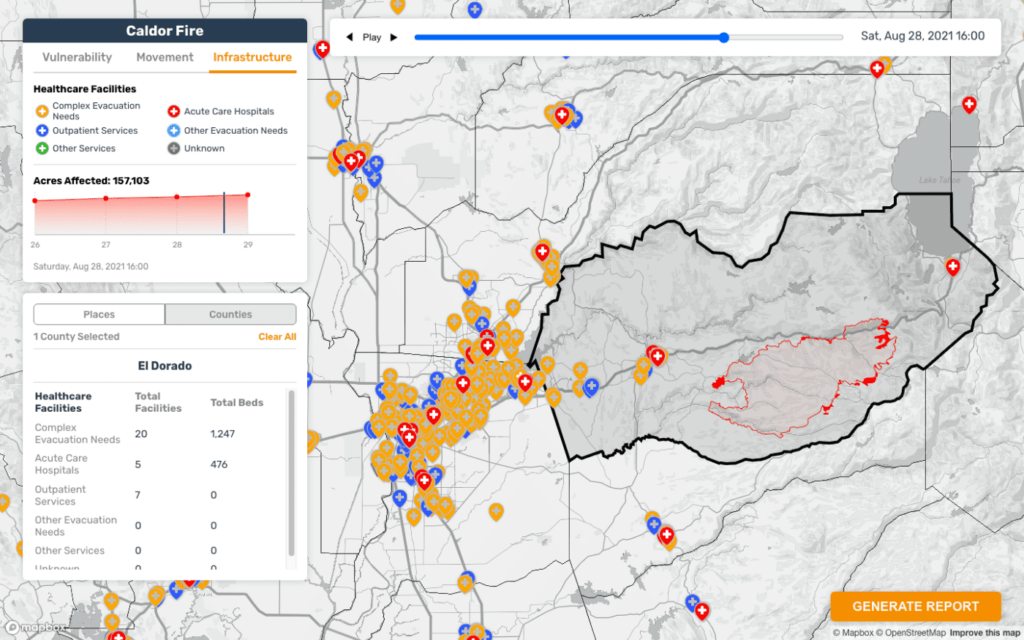
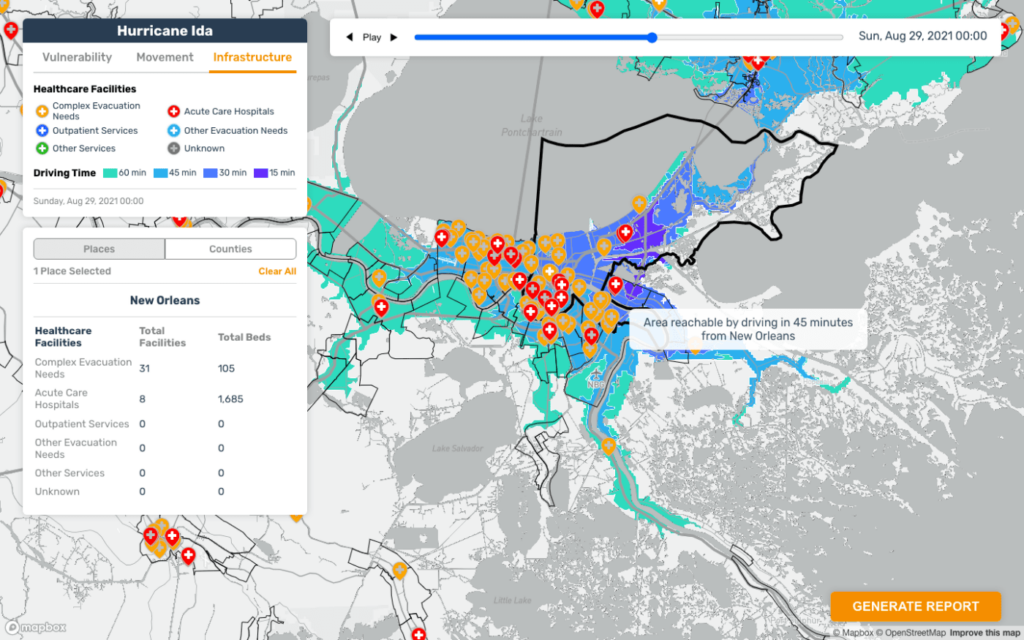
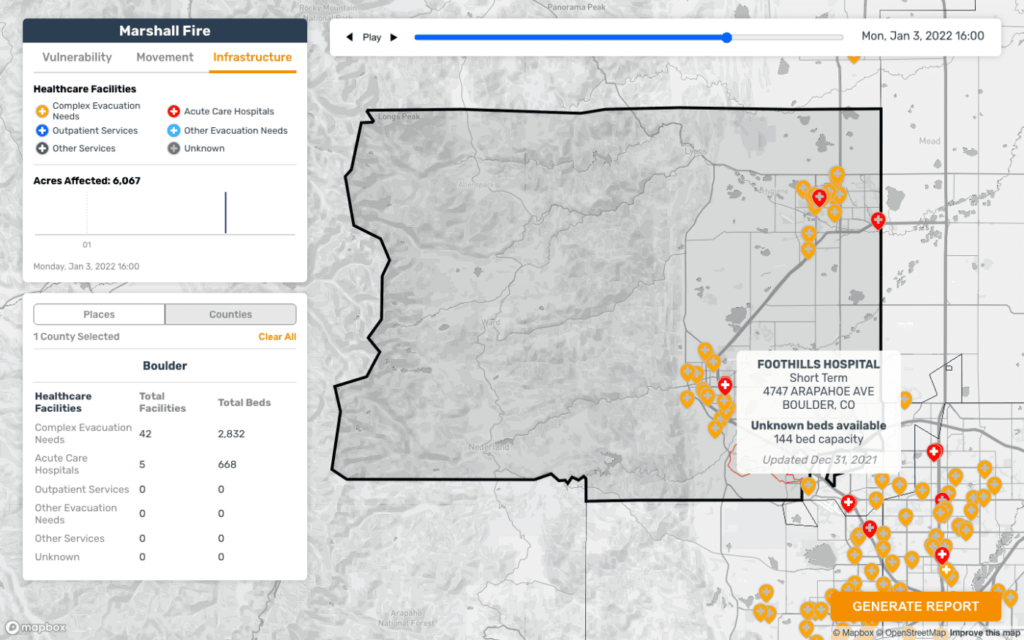
These data provide information on the capacities of nearby healthcare facilities and the disruptions in critical infrastructures (or hazards) that may result in large-scale disaster situations.
Just as routine forecasting for epidemics is an important goal for pandemic preparedness, anticipating both the immediate surge in patients and the longer-term dynamics of the medical needs of communities displaced by a natural disaster ought to become the routine to improve response.
Seamless Report Generation
Customizable reports may be generated in portable document format to provide curated insights that meet specific user needs. Dashboard visualizations can be captured in these reports, filtered by geography, time, and other attributes of interest. The PDFs are modular, allowing users to include or exclude entire sections, and rearrange the flow of information. The digital versions include smart navigation functions.